Developer velocity isn't just about code review speed or deployment frequency. It's about total time from "We have a problem" to "The problem is fixed and deployed." Every hour QA spends clarifying a bug report or developers spend hunting for information is an hour of lost velocity. High-quality bug reports with complete context accelerate the entire development process.
The Hidden Cost of Poor Bug Reports
When QA says "The dashboard is slow," developers need more information:
- What browser? (Safari might behave differently than Chrome)
- How many records? (Slow with 10,000 records but fast with 100?)
- What network speed? (5G vs 3G makes a difference)
- What did you do to trigger the slowdown?
- Have a screenshot of the performance timeline?
The investigation spiral begins:
Developer 1 (30 min): Tries to reproduce locally—can't do it. Asks QA for more details.
QA responds (24 hrs later): "On the production dashboard with our actual dataset."
Developer 2 (45 min): Reproduces on production. Sees performance issue. Needs to understand data patterns. Asks database team.
Database team (24 hrs later): Provides query analysis.
Developer 2 (1 hr): Identifies slow query. Implements fix. Creates PR.
Code review (2 hrs): Reviewer questions query logic.
Developer 2 (30 min): Updates implementation.
Total time: 2+ days to fix a bug that took 1 hour to actually solve.
With a complete bug report including session replay, performance profile, and environment details? Developer 1 fixes it in 1 hour.
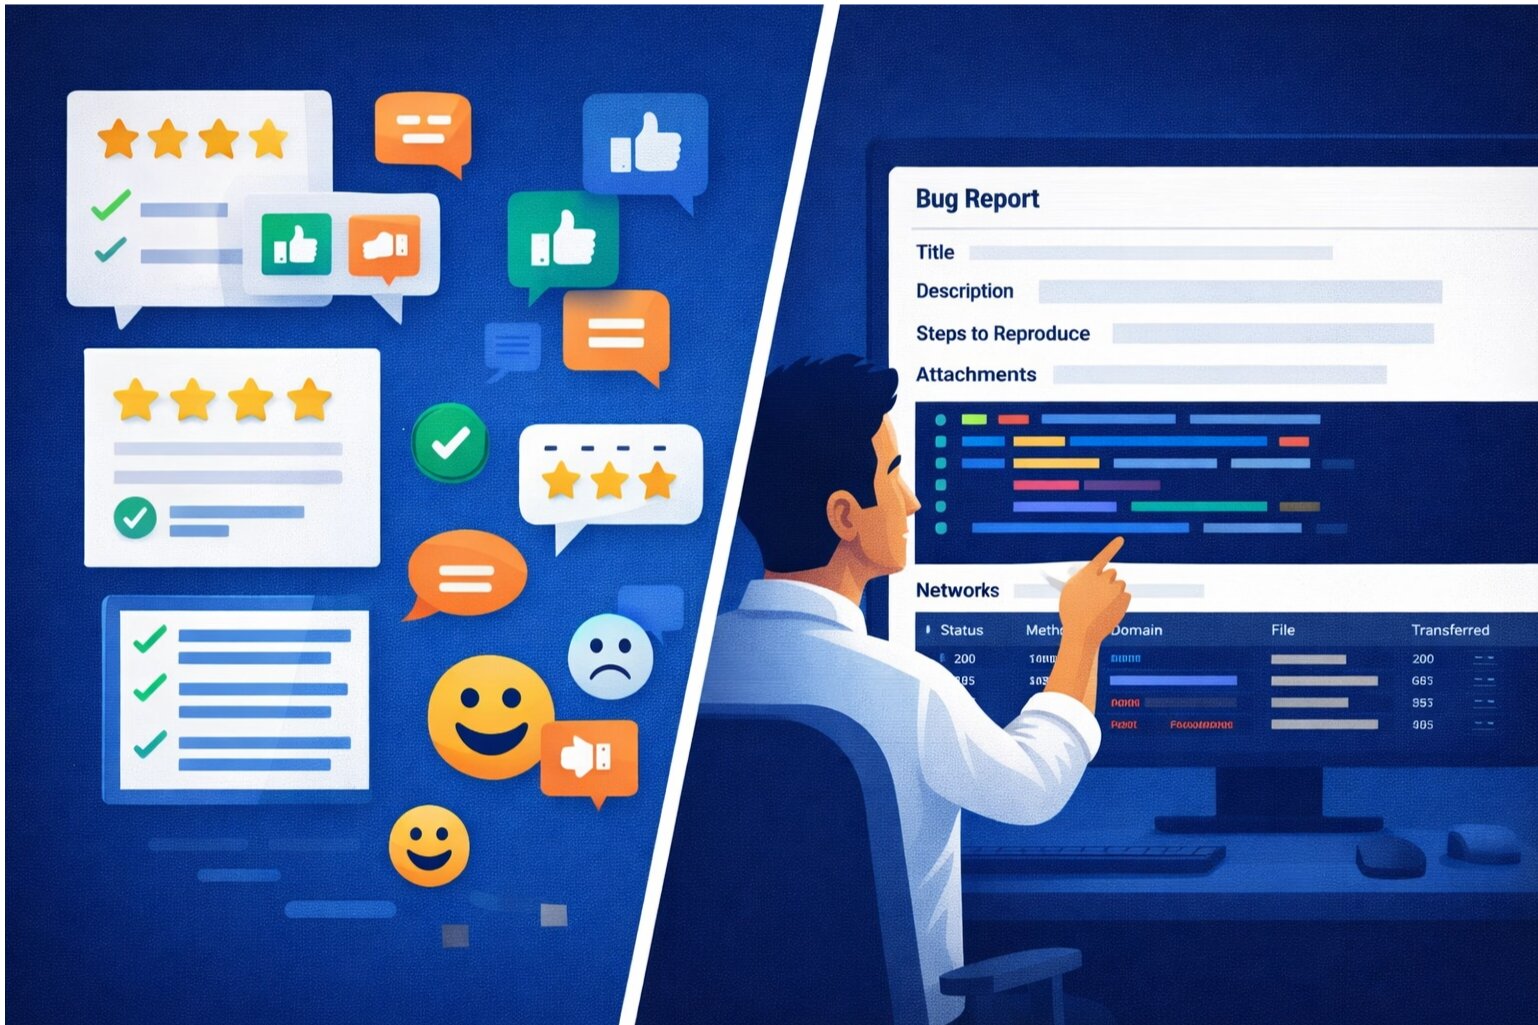
What High-Quality Bug Reports Include
1. Complete Environment Information
Browser, OS, viewport size, network speed, app version. These details determine which code paths execute and how the system performs.
2. Exact Reproduction Steps
Numbered steps anyone can follow. Not "it happens sometimes," but "this sequence triggers it 100% of the time."
3. Visual Evidence
Screenshots show what users see. Session replays show how they got there. Together, they eliminate guesswork.
4. Performance Data (When Relevant)
If it's a performance bug, include metrics: Time to Interactive = 5 seconds (should be 2 seconds). CPU profile. Network waterfall. This accelerates root cause analysis.
5. Error Context
Stack traces, API responses, console errors. Give developers the information they need to spot the problem immediately.
6. Business Impact
"This affects 10% of checkout flow on mobile" matters more than technical details alone. It helps developers prioritize.
The Multiplier Effect on Velocity
When one developer wastes 2 hours investigating a poorly reported bug, the velocity hit is more than just that developer's time:
- Developers who were waiting for that fix remain blocked
- QA might spend time on follow-ups that could have been prevented
- Context switching delays work on other features
- The fix might be incomplete because context was missing
Studies show that unclear issue reports can increase investigation time by 50-300% depending on complexity. For a team of 10 developers each investigating 3 unclear bugs per sprint, that's 5-15 days of wasted engineering per sprint.
High-quality reporting cuts investigation time by half or more. For a 10-person team, that's 2-7 days of recovered velocity per sprint. Over a quarter, that's a full sprint of recovered capacity.
Building a Bug Report Culture
Set Expectations
Make it clear: bug reports need complete context. Vague reports get rejected with a request for more details. This might feel harsh initially, but it trains the team to report better.
Provide Templates and Examples
Show QA exactly what you need. Provide templates. Share examples of good and bad reports. Help them understand how better reports help developers.
Automate Context Collection
Don't rely on humans to remember to include browser version and network speed. Capture these automatically. Let QA focus on describing the issue, not gathering context.
Use Tools That Encourage Quality
Tools like SnagRelay that automatically capture screenshots, session replays, browser info, and network logs make high-quality reporting effortless. QA just describes what they see, and the tool captures everything else.
Measuring the Impact
Track these metrics to quantify the velocity impact:
- Average time to fix a bug: Target 50% reduction as reporting improves
- Developer follow-up questions per bug: Each follow-up costs time. Target: Zero follow-ups for 80% of reports
- First-fix rate: Percentage of bugs fixed on first attempt. Poor context = rework. Target: 95%+
- Time from report to deployment: Track end-to-end time. Better reporting should reduce this significantly
Beyond the Obvious
Great bug reports also prevent developers from worrying about things that don't matter. When a report includes "tested on latest Chrome, Firefox, and Safari on macOS and Windows," developers know it's not a browser-specific issue and can focus on the actual problem.
The Feedback Loop
As developers spend less time investigating and more time fixing, they can provide faster feedback to QA. Faster fixes mean faster testing. The team runs faster. Velocity compounds.
Invest in bug report quality. It pays dividends across your entire development process.
Start building a bug report culture. SnagRelay makes it effortless to collect complete context with every report, accelerating your entire development process.