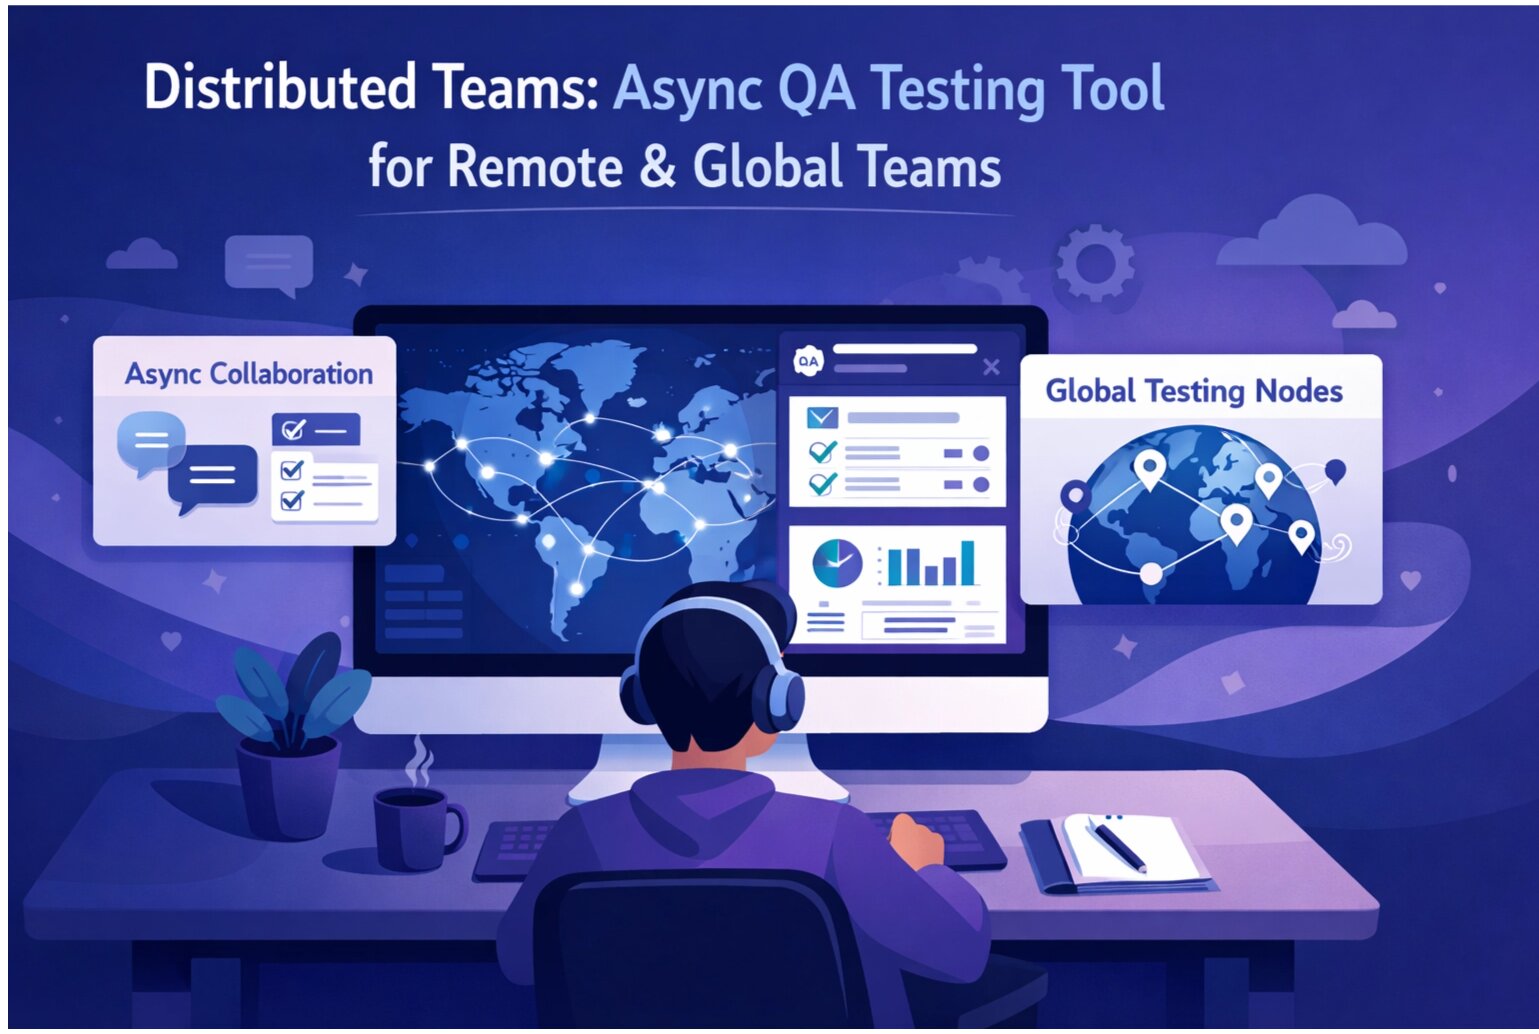
Debugging synchronously is hard enough. Debugging across time zones is brutal. "Let me screen share and show you the issue" doesn't work when collaborators are 12 hours apart. Remote teams need async-first debugging practices that don't require everyone online simultaneously.
The Challenges of Remote Debugging
Time Zone Friction: A developer in San Francisco and QA in India can't easily sync up. By the time the developer logs on, QA has already logged off.
Incomplete Context Sharing: Screenshots capture a moment. They don't show the steps that led there or the network activity. Video recordings help but are hard to index and search.
Communication Delays: "I need more details" becomes a 24-hour turnaround. Each clarification round costs a full day.
Debugging Without Pairing: Debuggers can't jump into a pairing session to figure things out together. Everything needs to be explicit and documented.
The Async-First Debugging Framework
1. Complete Issue Capture
Make the initial report so complete that it requires zero follow-ups. Include:
- Environment (exact browser, OS, app version)
- Reproduction steps (numbered, step-by-step)
- What happened (describe the bug)
- What should happen (expected behavior)
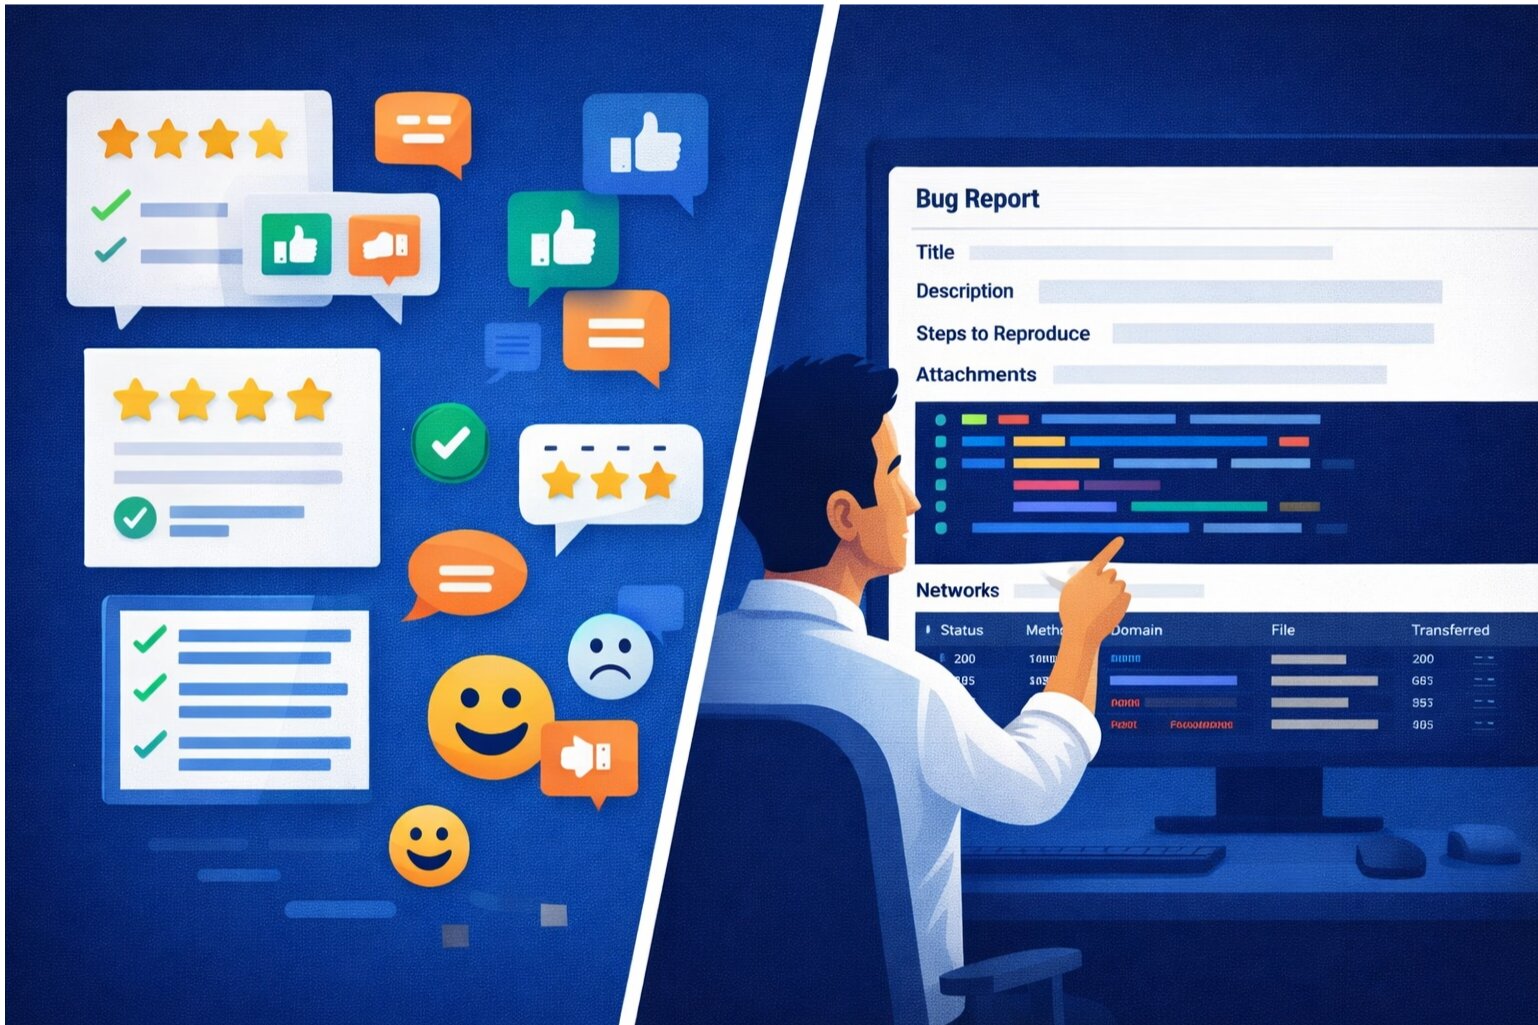
- Evidence (screenshot, session replay, network profile)
- When it started (if known)
- Reproduction rate (100% or intermittent?)
This completeness prevents the investigation stall that happens when developers need clarification.
2. Structured Investigation Artifacts
Don't just describe the problem—provide investigation artifacts:
- Browser DevTools screenshots showing network tab, console, performance profile
- Server logs if available
- Database query results if relevant
- Session replay showing user actions
Let developers read the evidence instead of asking you to reproduce it again.
3. Documented Debugging Steps
When a developer investigates, document their findings:
- "Checked browser version—Safari on iOS 17"
- "Examined network requests—API returns 200 but empty data array"
- "Reviewed database query—seems to be filtering out all results"
This narration helps teammates who pick up the investigation later understand what's already been ruled out.
4. Hypothesis-Driven Investigation
Instead of aimless debugging, post hypotheses:
- "Hypothesis: The issue occurs when users have specific data patterns. Testing with dataset X."
- "Hypothesis: Mobile-specific. Verified on desktop—works fine."
- "Hypothesis: Timing-related. Adding logging to confirm."
This structure helps teammates evaluate your investigation and spot holes in logic.
Tools for Async Remote Debugging
Session Replay
The single best tool for async debugging. Record user interactions, environment, network activity, and console state. A developer can review the replay asynchronously and understand the issue without pairing.
Performance Profiles
Capture CPU profiles, memory snapshots, and network waterfall diagrams. These provide objective evidence about performance issues without requiring reproduction.
Structured Logging
Implement logging that answers common questions: "What data was the user seeing? What API calls failed? What database queries were slow?" Structured logs let developers understand behavior without being present.
Error Tracking with Replay Links
When errors occur, automatically capture session replays. Link them to error tracking tools. Developers see the error and can immediately watch what happened before it.
Async Video Walkthroughs
For complex issues, record a 2-3 minute video walking through reproduction steps and findings. Easier to consume than live pairing, and teammates can rewatch.
Workflow Example: Bug Reported in San Francisco, Fixed in India
Friday 5 PM (San Francisco): QA reports bug with complete session replay, screenshots, and reproduction steps.
Saturday 9 AM (India): Developer reviews session replay, examines code. Finds the issue. Posts hypothesis and proposed fix in shared channel.
Saturday 5 PM (India): Developer opens PR with fix. Includes session replay link in PR description.
Monday 10 AM (San Francisco): Developer reviews PR, watches session replay to understand context, approves.
Monday 10:30 AM (San Francisco): Fix deployed. Closed in ~3 business hours of work spread across time zones.
Without async practices, this would have stalled for days waiting for synchronous pairing.
Documentation as a Debugging Asset
For remote teams, documentation serves double duty: it guides new team members AND it provides context for async debugging.
Document system architecture, common failure modes, known issues, and how to investigate them. When a similar bug appears, developers can self-serve answers instead of waiting for someone to be online.
Automating What You Can
Remove the need for manual context gathering. Automatically capture:
- Browser and OS info when bugs are reported
- Session replays for errors
- Performance profiles under load
- Network waterfall diagrams
- Database query logs
The more context is captured automatically, the less back-and-forth is needed.
The Async Culture Shift
Moving to async debugging requires a mindset shift. Instead of "Let me debug this with you," it's "Here's what I investigated, here are my findings." Instead of "That's weird, I can't reproduce it," it's "Here's the session replay and all the context you need."
Teams that embrace async debugging gain a superpower: they're not blocked by time zones. A team in San Francisco reports issues. A team in Europe investigates. A team in India fixes. The work never stops.
The Remote Team Advantage
Well-documented async debugging practices aren't just necessary for remote teams—they're better for all teams. Explicit communication, complete documentation, and artifact-driven investigation create a more scalable, maintainable debugging process.
Build better remote debugging practices. SnagRelay's session replay and automatic context capture make async debugging seamless.