One timeline, not three tools
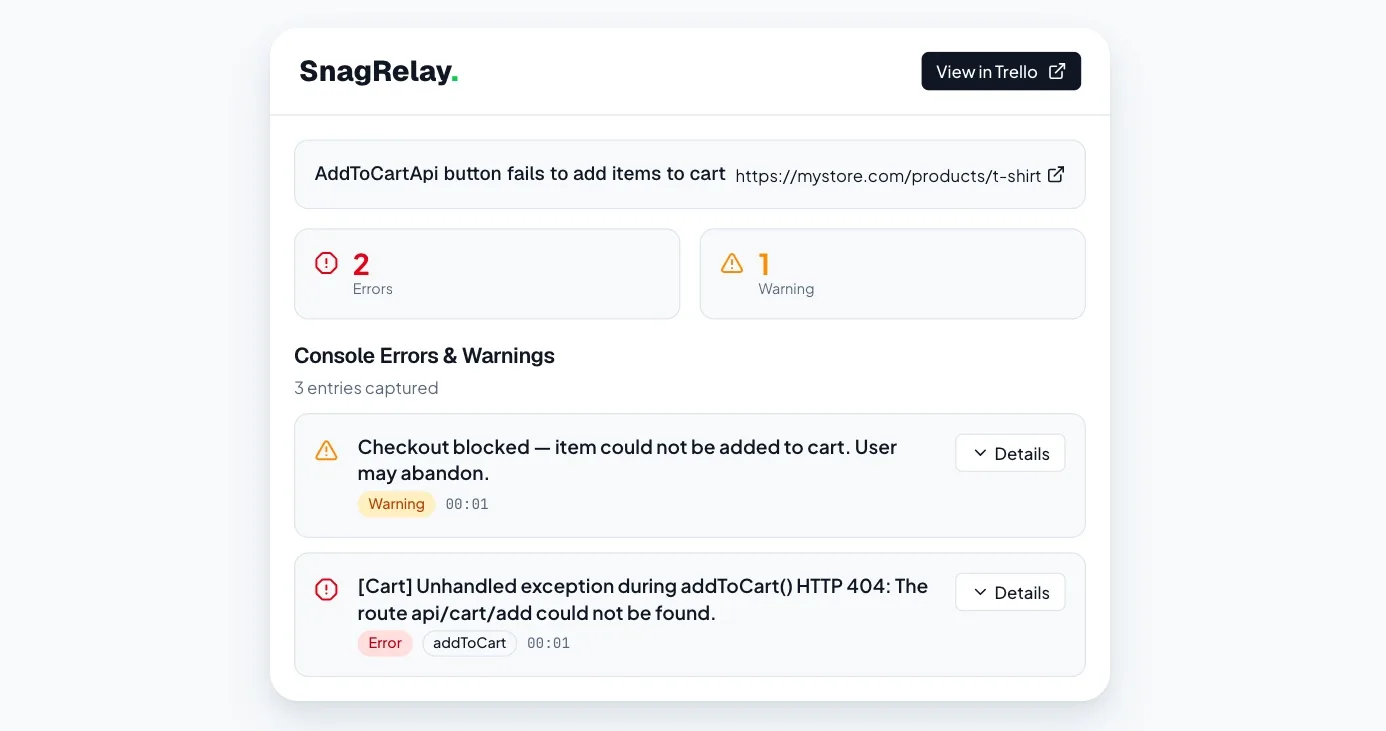
A typical debug loop: open Sentry for the error, open LogRocket for the session, open the network tab for the API call, cross-reference the Jira ticket. SnagRelay collapses all of this into a single timeline in the bug report — user action → network request (with full payload) → JS error with stack trace and component location. The causal chain is explicit.
Smart Error Summary
Every report with an error trace gets an automatic plain-language diagnosis — cross-referenced against the session replay and the API response body. Developers see the likely cause and fix direction before opening a single file.
AI Agent Ready
Every report generates a shareable link. Paste it into Cursor, Copilot, Devin, or any AI coding agent. The agent receives the full context — DOM, payload, error, stack trace — and can propose a fix immediately. No vague descriptions, real data.